


Last Updated on February 8, 2026 by Rajeev Bagra
Understanding correlation is essential in data analysis, finance, marketing, and business intelligence.
In this tutorial, you will learn:
✅ What Pearson correlation really measures
✅ Why “no correlation” happens
✅ How the formula works
✅ When Pearson fails
✅ How professionals use it in finance
✅ How to interpret graphs correctly
🔹 1. What Is Pearson Correlation?
The Pearson Correlation Coefficient (r) measures:
How strongly two variables move together in a straight-line pattern.
Its value lies between:
| Value | Meaning |
|---|---|
| +1 | Perfect positive |
| 0 | No linear relation |
| –1 | Perfect negative |
Example:
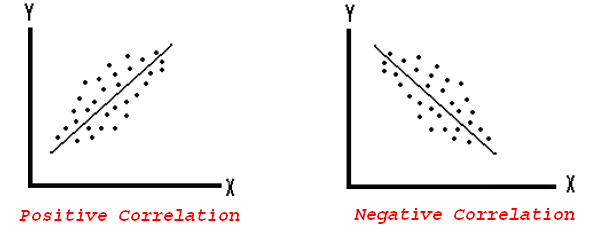
- Ads ↑ → Sales ↑ → Positive
- Rates ↑ → Loans ↓ → Negative
🔹 2. Important Rule: Pearson Is About X vs Y (Not Time)
Many beginners think:
“If X and Y are both straight over time, they are correlated.”
❌ This is wrong.
Pearson does NOT care about time.
It only looks at:
How Y changes when X changes.
So always think:
📌 Plot Y against X — not against time.
🔹 3. The Pearson Formula

What It Means in Simple Words
Correlation = (How X and Y move together) ÷ (How much they move separately)
🔹 4. How the Formula Detects Relationship
The key part is:

This multiplies deviations.| X moves | Y moves | Result |
|---|---|---|
| Up | Up | + |
| Down | Down | + |
| Up | Down | – |
| Down | Up | – |
If many + → Positive r
If many – → Negative r
If + and – cancel → r ≈ 0
That is how “no correlation” appears.
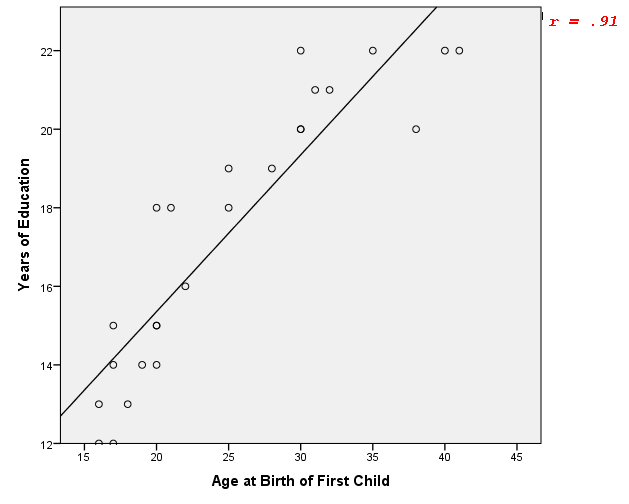
📈 5. Understanding Correlation Using Graphs
Always draw a scatter plot before trusting r.
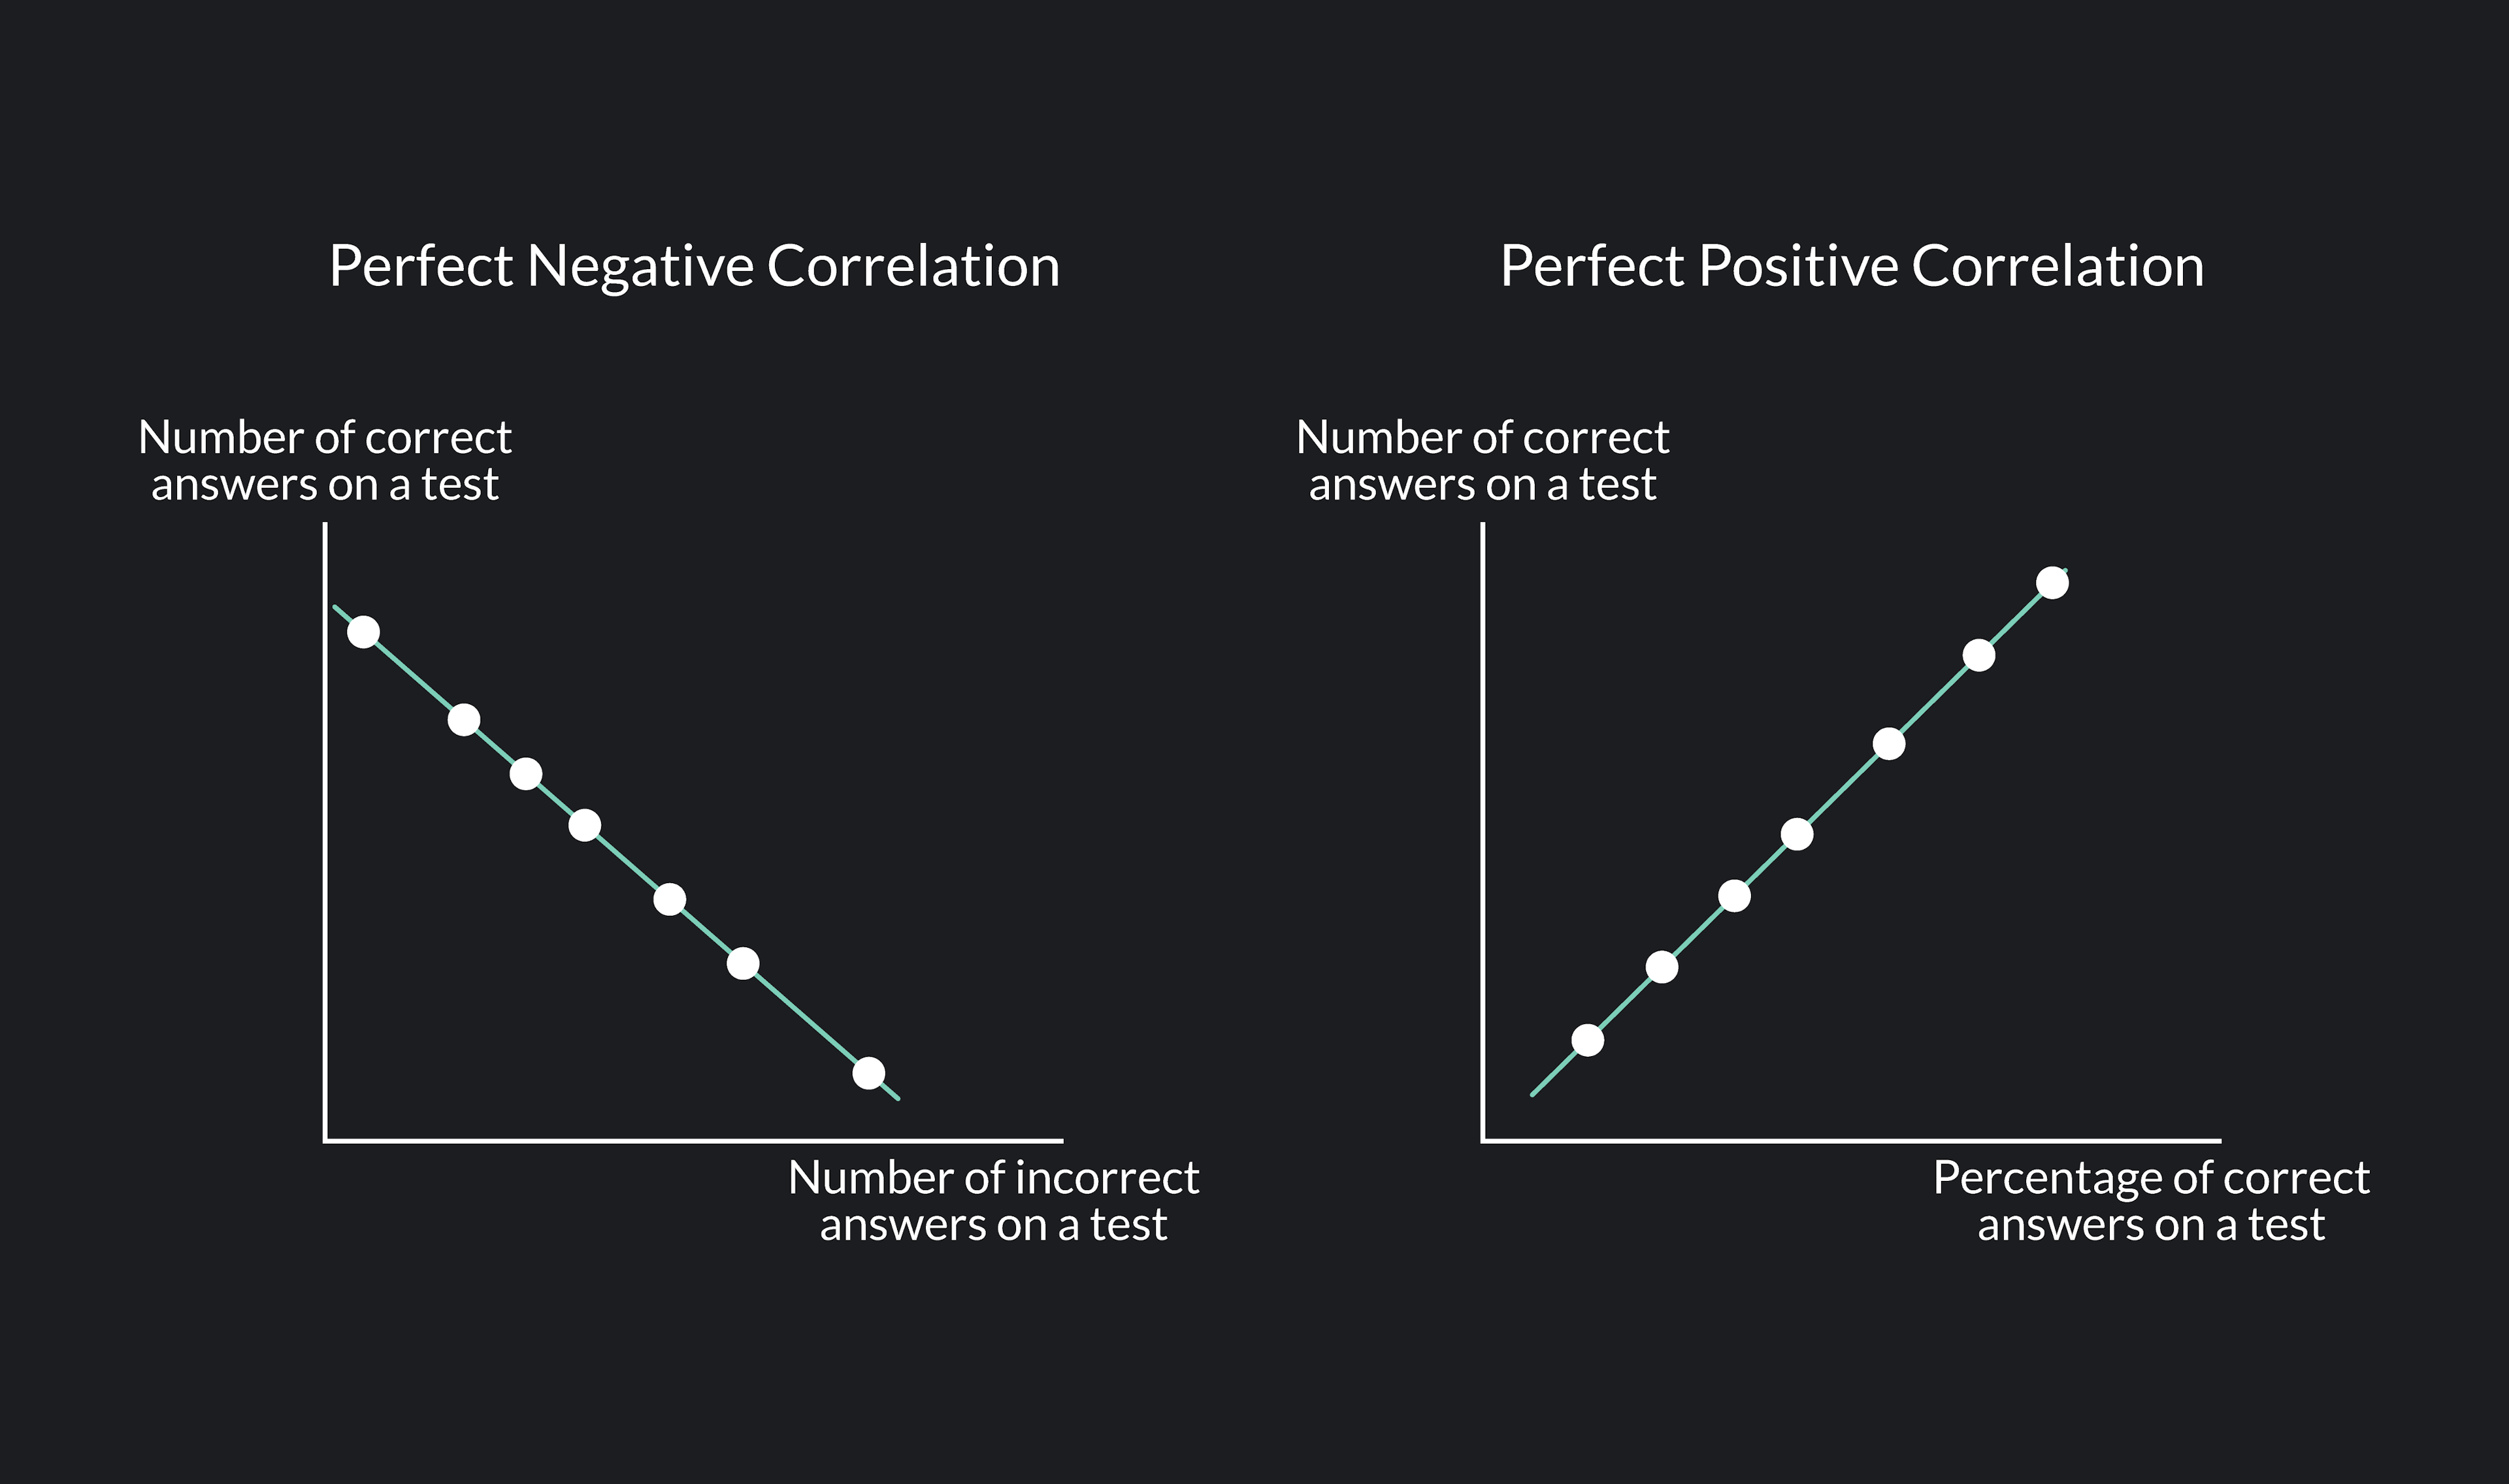
✅ A. Perfect Positive Correlation ( r = +1 )


Example Dataset
| X | Y |
|---|---|
| 1 | 2 |
| 2 | 4 |
| 3 | 6 |
| 4 | 8 |
| 5 | 10 |
Here:

All points lie on one rising line.❌ B. Perfect Negative Correlation ( r = –1 )


Example Dataset
| X | Y |
|---|---|
| 1 | 10 |
| 2 | 8 |
| 3 | 6 |
| 4 | 4 |
| 5 | 2 |
Here:

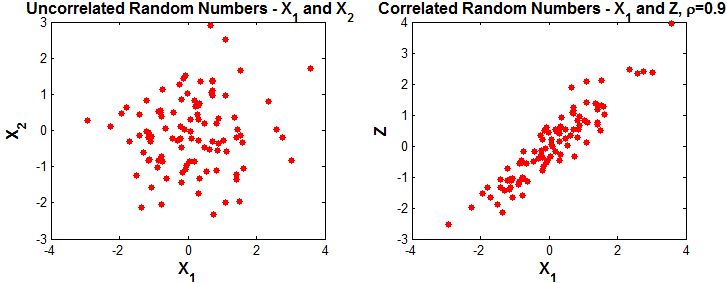
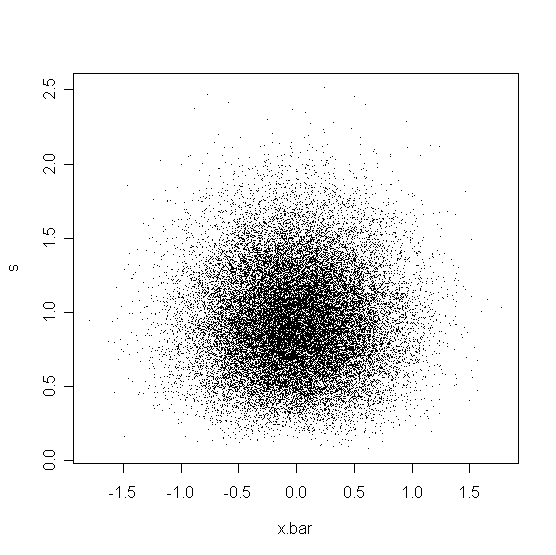
One rises, the other falls.⚪ C. No Linear Correlation ( r ≈ 0 )


Example Dataset
| X | Y |
|---|---|
| 1 | 7 |
| 2 | 3 |
| 3 | 9 |
| 4 | 4 |
| 5 | 6 |
Here:

Products cancel → no straight-line pattern.
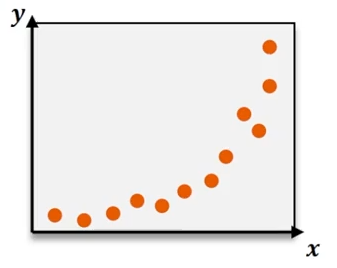
🔀 D. Non-Linear Relationship ( Pearson Fails )


Example
| X | Y |
|---|---|
| 1 | 1 |
| 2 | 4 |
| 3 | 9 |
| 4 | 16 |
| 5 | 25 |
Here:

Strong relationship ❗
But Pearson → r ≈ 0 ❌
Because it is curved.
🔹 6. Correlation ≠ Causation
Correlation does NOT mean cause.
Example:
- Ice cream sales ↑
- Drowning ↑
Both caused by summer.
Not by each other.
💼 7. How Finance Professionals Use Correlation
🏦 A. Portfolio Diversification
Goal: Reduce risk.
| r Value | Meaning |
|---|---|
| > 0.8 | Risky |
| < 0.3 | Good |
| < 0 | Hedge |
They prefer:
![r<0.3[/latex] <pre class="wp-block-code"><code> </code></pre> <hr class="wp-block-separator has-alpha-channel-opacity"/> <h2 class="wp-block-heading">📊 B. Stock vs Index</h2> <p>Check:</p> <p>Stock Return vs Market Return</p> <p>High r → market dependent<br>Low r → independent stock</p> <hr class="wp-block-separator has-alpha-channel-opacity"/> <h2 class="wp-block-heading">💳 C. Banking & Loans</h2> <p>Interest Rate vs Loan Demand</p> <p>Usually:</p> [latex]r<0[/latex] <pre class="wp-block-code"><code> Used for pricing.</code></pre> <hr class="wp-block-separator has-alpha-channel-opacity"/> <h2 class="wp-block-heading">📢 D. Marketing ROI</h2> <p>Ads vs Sales</p> <p>If:</p> [latex]r>0.7](https://s0.wp.com/latex.php?latex=r%3C0.3%26%2391%3B%2Flatex%26%2393%3B++++%3Cpre+class%3D%22wp-block-code%22%3E%3Ccode%3E+%3C%2Fcode%3E%3C%2Fpre%3E++++%3Chr+class%3D%22wp-block-separator+has-alpha-channel-opacity%22%2F%3E++++%3Ch2+class%3D%22wp-block-heading%22%3E%F0%9F%93%8A+B.+Stock+vs+Index%3C%2Fh2%3E++++%3Cp%3ECheck%3A%3C%2Fp%3E++++%3Cp%3EStock+Return+vs+Market+Return%3C%2Fp%3E++++%3Cp%3EHigh+r+%E2%86%92+market+dependent%3Cbr%3ELow+r+%E2%86%92+independent+stock%3C%2Fp%3E++++%3Chr+class%3D%22wp-block-separator+has-alpha-channel-opacity%22%2F%3E++++%3Ch2+class%3D%22wp-block-heading%22%3E%F0%9F%92%B3+C.+Banking+%26+Loans%3C%2Fh2%3E++++%3Cp%3EInterest+Rate+vs+Loan+Demand%3C%2Fp%3E++++%3Cp%3EUsually%3A%3C%2Fp%3E+++%5Blatex%5Dr%3C0%26%2391%3B%2Flatex%26%2393%3B++++%3Cpre+class%3D%22wp-block-code%22%3E%3Ccode%3E+Used+for+pricing.%3C%2Fcode%3E%3C%2Fpre%3E++++%3Chr+class%3D%22wp-block-separator+has-alpha-channel-opacity%22%2F%3E++++%3Ch2+class%3D%22wp-block-heading%22%3E%F0%9F%93%A2+D.+Marketing+ROI%3C%2Fh2%3E++++%3Cp%3EAds+vs+Sales%3C%2Fp%3E++++%3Cp%3EIf%3A%3C%2Fp%3E+++%5Blatex%5Dr%3E0.7&bg=ffffff&fg=000&s=0&c=20201002)
Campaign works.🔹 8. How Professionals Decide “No Relationship”
They NEVER trust r alone.
They check:
✅ |r| < 0.2
✅ p-value > 0.05
✅ Scatter plot
✅ Stability over time
✅ Business logic
Only then:
“Probably independent.”
🔹 9. When NOT to Use Pearson
Do NOT use Pearson when:
❌ Data is curved
❌ Data is ranked
❌ Data has outliers
❌ Regimes change
Use instead:
- Spearman
- Regression
- Nonlinear models
🔹 10. Step-by-Step Method for Learners
Before using Pearson, always follow this:
Step 1
Plot X vs Y
Step 2
Ask: “Is it roughly straight?”
Step 3
If yes → Use Pearson
Step 4
Compute r
Step 5
Check if |r| > 0.3
Step 6
Interpret with business logic
📌 Final Summary
| Topic | Key Idea |
|---|---|
| Pearson Measures | Linear relationship |
| r ≈ 0 Means | No straight-line pattern |
| Not Meaning | No relationship at all |
| Always Do | Plot first |
| Finance Use | Risk control |
✅ Final Takeaway
Pearson correlation tells you how well two variables move together in a straight line. A value near zero means no strong linear pattern, not necessarily no relationship.
Discover more from Progaiz.com
Subscribe to get the latest posts sent to your email.
Leave a Reply